Hopkins Statistics Analysis
To analyze the distribution of macrophages over time in an entire zebrafish larvae, we applied the Hopkins statistics (Manuscript Figure 3). A high value of the Hopkins statistics H indicates that the underlying data shows a high cluster tendency, e.g., H>0.75 indicates a cluster tendency at the 90% confidence level.
Zebrafish volume approximation
The Hopkins statistics requires the simulation of random points. To do this, we obtained an approximation of the 3D zebrafish volume as a space for possible locations of cells. With these positions, we could compare the real observed spatial distribution (real positions) against randomly generated distributions (random positions).
To obtain the zebrafish volume, we wrote an ImageJ macro. To run it, drag and drop the
generate_fish_outline_forSegmentation_percentile.ijm
file into Fiji and modify the imagename, parentfolder (where all timepoints are saved),
savefolder (where to save the 3D stacks with the volume) and savefolder_max (where the maximum intensity
projections of the 3D stacks for quick visualization) are saved.
imagename = "1_CH594_000000.tif"
parentfolder= "~/fish1"
savefolder= "~/fish_volume"
savefolder_max= "~/fish_volume_max"
Hopkins statistics calculation with Matlab
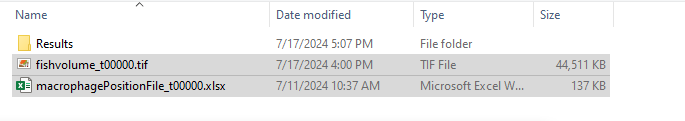
Next, a Matlab script enables calculation of the Hopkins statistic. It requires a list of position of real cell positions in an Excel file (macrophagePositionFile_t00000.xlsx) from the low-resolution segmentation and an image with a binary mask for the volume wherein random positions are simulated (fishvolume_t00000.tif).
.
|-- TimeSeries
|   |-- t00000
|   |   |-- fishvolume_t00000.tif
|   |   |-- macrophagePositionFile_t00000.xlsx
        ...
If you run the Matlab code, first set Matlab’s path to include all the Matlab functions provided by
the HopkinsStatistics_Lowres package on the GitHub repository,
using the Set Path
button in Matlab (Home > Environment > Set Path> Add with subfolders).
To run the Hopkins Statistics, open runLowResAnalysis_US2O.m by typing “edit runLowResAnalysis_US2O”
in Matlab’s command window. runLowResAnalysis_US2O.m is the main script to
analyze cell clustering in a (changing) volume over an entire experiment. In this script,
revise the “imageDirectory” for loading the data and “saveDirectory”
for saving the results. Save the changes to the script and run the function
by typing runLowResAnalysis_US2O in Matlab’s command window.
Matlab compiled version
If you do not have access to Matlab, we provide a compiled version of the code as “.exe” file. To run it, please double click on the compiled version and follow the installation instructions. In the installation process also a Matlab runtime environment is installed to run the code. After installation, the compile code is ready to run.
For this, click on MatlabCompiler_measureCurvature.exe to run the code and follow the prompts to select a .tif and file.
As an output, an Excel file (lowResResults.xlsx) is generated with all the results of the random permutations (n=350) of positions used to calculate the Hopkins statistics.
Test data for cell shape feature analysis
Test data is available for the Hopkins statistics analysis in the folder Exemplary_HopkinsDataset:
- on Synapse:
- or Zenodo:
It contains a folder to a single timepoint containing the positions of macrophages in a zebrafish xenograft model and the approximation to the fish volume.